Land Price Estimation
The real estate module of SILO updates costs for dwellings based on current demand. This has an impact on household relocation decisions. In future years, the land price is adjusted based on supply and demand for housing. For the base year, residential land prices were estimated based on official land price records.
Dataset
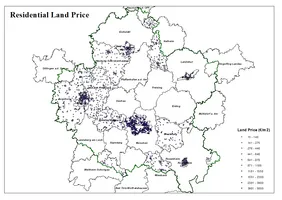
The land price data was collected from the respective municipal agencies (in German: Gutachterausschuss) and was available for some regions of the study area only. Most land prices were provided as geo-located point data. For some areas, the data were provided as a shapefile in the form of polygons and were converted to points (as centroids of polygons). Only residential land prices provided in Euro per square meter were used for this purpose. There were a total of 2,124 data points for analysis as shown in the map below with the values according to the color ramp.
Model Estimation
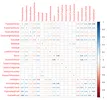
These land prices were estimated using multiple regression analysis. The correlation matrix of the variables considered for this model are shown in figure 1 below. The population density and employment density are zonal variables and were obtained by dividing population and employment by the respective zonal areas. Two additional variables were created: one as a product of population and employment density (PopDmultiplyEmpD) and the other as a sum of population and employment density (PopDaddEmpD) (see figure 1) .
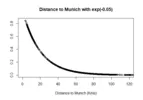
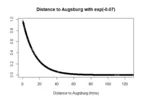
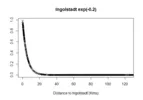
The distance to important city centers were also considered with variables as distance to Munich, Augsburg, Ingolstadt, Rosenheim and Landshut. The distance is calculated from each geo-located data point to the respective city center. These distances are in kilometers and were obtained in through google maps and were scaled using exponential functions. Figures 2-4 shows exponential function parameters for the respective distance to city centers. The exponential factor for Munich is selected such that it influences areas within 70 km from the city center, as Munich is the hub of economic activities and the largest city in the state of Bavaria. The exponential factor for Augsburg can influence areas within 55 km from the city center and rest of the cities are much smaller and have factors that can influence land prices up to 20 km from the respective city centers. The variable minDistance is the minimum of all the city centers distance from a respective geo-located data point.
Results
The model estimation results are shown in the table below, showing the significant variables after multiple iterations of variable selection. The regression equation has an R2 = 0.719, which shows that the model has been able to explain almost 72% of the variation in the dataset.

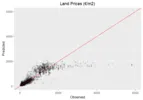
The model performance can be shown graphically by observed v/s predicted land price values plot (see left below). It shows that the model is able to predict land prices below €2,500 reasonably well, while the model is not able to predict the most expensive places in the study area, but those are rather few places.
The center figure below shows the worst outliers where the model underestimates land values. Those areas in Munich close to the English Garden and the Nymphenburg Castle are among the most attractive (and expensive) places to live in the area.
The outliers on the other end of the spectrum, i.e. where the model overestimates land values, are shown in the plot on the right below. Those locations seem rather randomly scattered. In the interest of ensuring maximum model sensitivity, no further (brute-force) adjustments were made. Overall, the model is able to replicate the distribution of land values reasonably well.
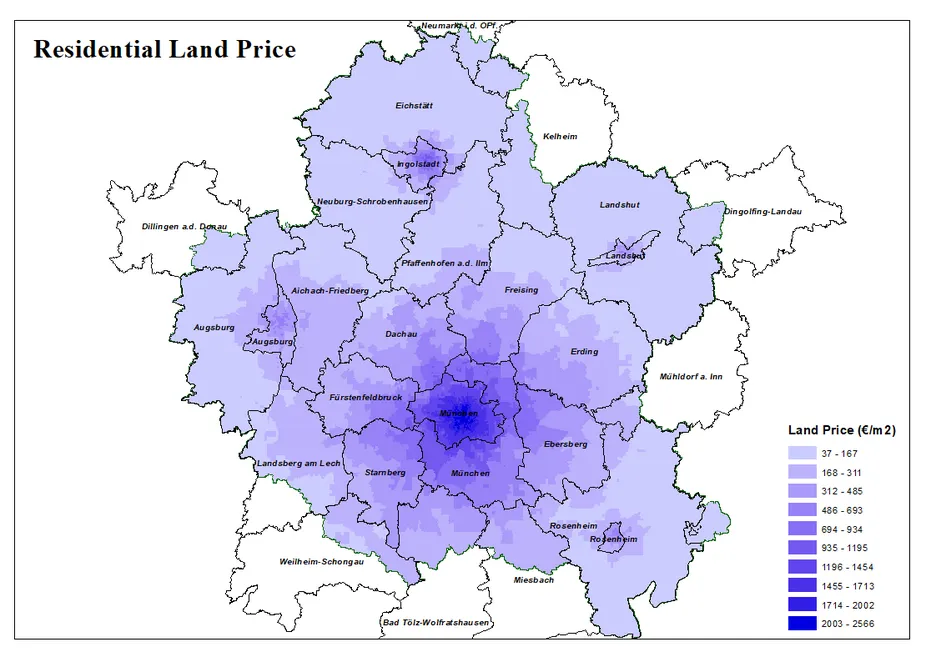
The land price for each zone of the study area was estimated using the hedonic regression model. The map on the right shows the estimated residential land prices for the study area. The colors on the map shows the residential land price per square meter for each zone. A clear color gradient can be observed from Munich city towards outskirts with the land price of Munich region being the highest and gradually decreasing to nearby areas. The same pattern can also be observed for other major cities in the study area, namely Augsburg, Ingolstadt, Rosenheim and Landshut.
