Mode Choice Model
Modeling mode choice is an essential element of the travel demand modeling framework. For trips made by a sample population, mode choice models predict the share of trips performed by each mode available.
Mode choice is a discrete choice problem where individual choice behavior is modeled econometrically using the principle of utility maximization. Individuals are modeled to choose the mode with the highest utility when confronted with a set of alternatives. Here, utility is the index of attractiveness of a mode, and is expressed as a function of the mode’s attributes. However, as individuals are not perfectly rational and modelers lack perfect information, a random component is added to utilities and a probabilistic choice approach is adopted. Utilities are thus expressed as the combination of a random error component (a random variable) and a deterministic component (a linear-in-parameter function of modal attributes and unknown parameters), and choice probabilities are established through a maximum-likelihood estimation in a logit-modeling framework. The logit model (Domencich & McFadden 1975) is particularly powerful at modeling discrete choices under limited information.
Modal utilities are expected to differ by purpose, for instance, individuals could be more accepting of longer travel times for leisure trips as opposed to trips to work. Hence, individual models were estimated for trips of each of the following six trip purposes:
- HBW: Home-Based-Work
- HBE: Home-Based-Education
- HBS: Home-Based-Shop
- HBO: Home-Based-Other
- NHBW: Non-Home-Based-Work
- NHBO: Non-Home-Based-Other
The models were based on daily trip data collected in the German national household travel survey, Mobilität in Deutschland 2008 (MiD2008). MiD is a repeated, cross-sectional survey conducted sporadically (once every 6 to 10 years) over an entire year to observe daily travel behavior of individuals and households. The survey can be accessed from Bundesministerium für Verkehr und digitale Infrastruktur (2009).
Model specification
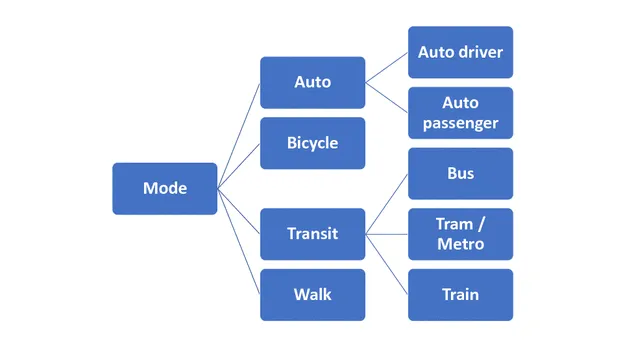
Choice is modeled among the following modes:
- Auto driver
- Auto passenger
- Bicycle
- Bus
- Train (sub-urban and regional)
- Tram or Metro
- Walk
Utilities of each mode are assessed in terms of the following attributes:
| Person attributes | Household attributes | Transport supply related attributes |
|---|---|---|
| Age | Household size | Generalized cost (travel time + travel cost in minutes) |
| Gender | Number of autos | Trip length (km) |
| Possession of driver's licence | Number of children | |
| Number of workers | ||
| Distance to nearest transit stop | ||
| Area type |
A simple multinomial logit structure assumes all the alternatives to be mutually exclusive. As some modes are more similar than others, a nested logit structure which accounts for correlation within nests is adopted. After examining different nested structure, the most appropriate structure was found to be one with Auto driver and Auto passenger in an Auto nest, and the three transit modes in a Transit nest, and with Bicycle and Walk as independent modes alongside Auto and Transit.
Model estimation
The unknown coefficients of modal attributes were estimated using Biogeme (Bierlaire 2016), an open source freeware designed for maximum likelihood estimations of discrete choice models. The estimations were sequentially carried out in an incremental manner to ensure a minimum 95% confidence level while avoiding significant correlations of independent variables. As an example, the model estimates for HBO trips are shown here.
| Auto driver | Auto passenger | Bicycle | Bus | Train | Tram/Metro | Walk | ||
|---|---|---|---|---|---|---|---|---|
| Intercept | 0 | 1.14 | 1.38 | 1.36 | 1.08 | 1.46 | 3.74 | |
| Male | 0 | -0.27 | 0.17 | -0.13 | - | -0.063 | -0.13 | |
| Possesses driver's licence | 0 | -1.34 | -1.51 | -1.91 | -1.66 | -1.74 | -1.30 | |
| Household autos | 0 | -0.029 | -0.57 | -1.54 | -1.56 | -1.72 | -0.30 | |
| Household size | 0 | - | - | -0.11 | -0.11 | -0.15 | -0.19 | |
| Distance to transit stop | 0 | - | - | -0.61 | -0.57 | -0.58 | -0.065 | |
| Generalized cost | -0.0012 | -0.0012 | 0 | -0.0012 | -0.0012 | -0.0012 | 0 | |
| Trip length | 0 | 0 | -0.15 | 0 | 0 | 0 | -0.68 |
In the estimations, Auto driver was chosen as the base mode against which utilities of the other modes are compared. Hence, its coefficient is 0 for all person and household attributes. The estimated intercepts indicate that the variables considered explain the choice of Walk the least, while Auto driver choice is best explained. Males are estimated to choose Bicycle more than and all other modes less than females for HBO trips. As one would expect, possession of driver’s license is estimated to reduce the utility of all other modes in comparison to Auto driver. The number of autos in a household also has a similar effect on the choice of modes other than Auto driver. Bigger households are estimated to prefer transit modes and Walk less for HBO trips. The variable was insignificant for Auto passenger and Bicycle and hence, was removed for these modes from the model. As distance from home to the nearest transit stop increases, Walk and transit modes are seen to become less attractive. A negative coefficient is estimated for Generalized cost which is measured as travel time plus travel cost converted to minutes using the following values of time (VOT, €/hr) classified by income categories:
| Income | Purpose | Auto driver | Auto passenger | Transit |
|---|---|---|---|---|
| < 1,500 € | HBW | 4.63 | 7.01 | 8.94 |
| Others | 3.26 | 4.30 | 5.06 | |
| 1,500 €- 5,600 € | HBW | 8.94 | 13.56 | 17.30 |
| Others | 6.30 | 8.31 | 9.78 | |
| > 5,600 € | HBW | 12.15 | 18.43 | 23.50 |
| Others | 8.56 | 11.30 | 13.29 |
As the choice of non-motorized modes – Bicycle and Walk – cannot be explained in terms of travel time and cost, trip length is considered for these modes instead. As trip length increases, Walk is seen to become less attractive than Bicycle.
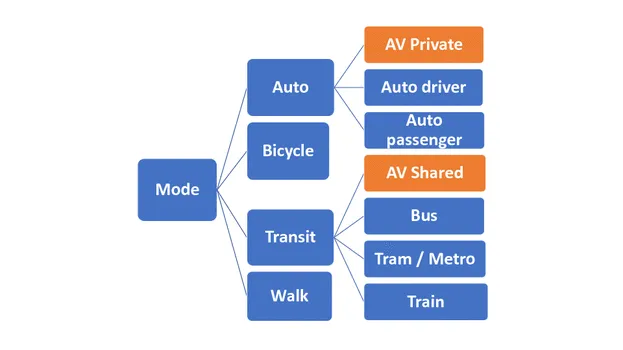
Autonomous vehicle choice
Autonomous Vehicles (AVs), or self-driving cars, are expected to be rolled out in as early as in a decade. Their availability is bound to impact travel behavior significantly. To model the impact of AVs on mode choice, the models described above were extended to model choice in a futuristic scenario with AVs in the choice set. Both privately owned AVs and AVs offered as a shared service were considered. Given that so little is known about their characteristics, they were modeled in an incremental logit approach (Koppelman 1983) considering AV Private as an improvement of Auto driver, and AV Shared as an improvement of a transit service – Bus. The modified model structure is shown here.
Private and shared AV choice probabilities were derived based on the following assumptions –
- AV private VOT = 75% of Auto driver VOT, as the task of driving is eliminated, private AVs would be perceived as less onerous than driving.
- AV shared VOT = Average of Auto passenger and transit VOTs, considering that shared AVs would be operated as a service similar to transit, while the level of convenience and comfort would be closer to that of Auto passenger.
- AV shared cost = Average of taxi and car-sharing unit charges, assuming that shared AVs would be priced higher than car-sharing due to higher maintenance and technology costs, but would be priced lower than taxi charges as driver fees are omitted.
References
Ben-Akiva, M., & Lerman, S. R. (1985). Discrete Choice Analysis: Theory and Application to Travel Demand. Massachusetts: MIT Press.
Bierlaire, M. (2016). PythonBiogeme: a short introduction. Report TRANSP-OR 160706, Series on Biogeme. Transport and Mobility Laboratory, School of Architecture, Civil and Environmental Engineering, Ecole Polytechnique Fédérale de Lausanne, Switzerland.
Bundesministerium für Verkehr und digitale Infrastruktur (2009). Mobilität in Deutschland: Publikationen zur Erhebungswelle 2008. Available at: www.mobilitaet-in-deutschland.de/mid2008-publikationen.html
Domencich, T.A., & McFadden, D. (1975). Urban Travel Demand: A Behavioural Analysis. North-Holland Publishing.
Koppelman, F., (1983). Predicting Transit Ridership in Response to Transit Service Changes. Journal of Transportation Engineering 109:4.