TUMDOT-ING
This data set contains multimodal trajectories of all types of road users at three intersections in Ingolstadt, Germany. The data was collected during the afternoon and evening peak hours on three consecutive weekdays using several aerial, camera equipped drones.
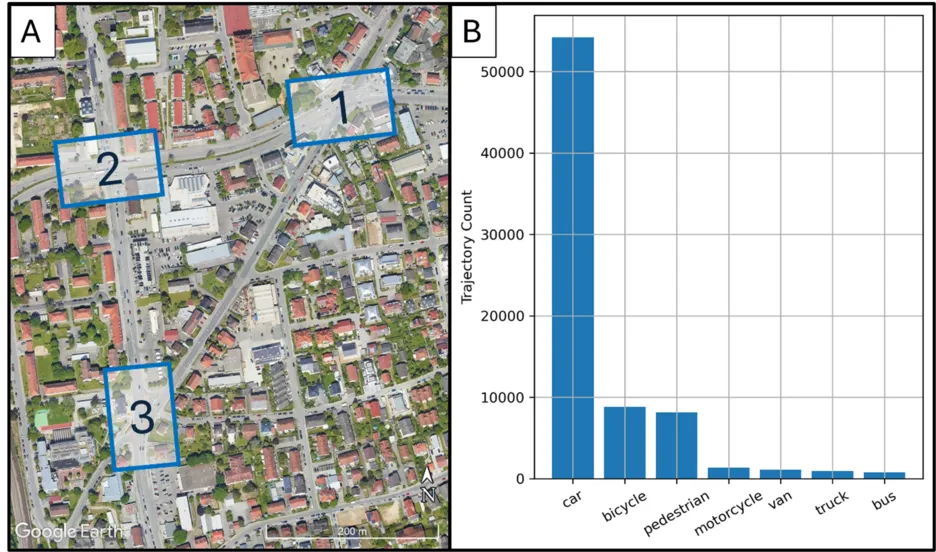
Figure 1: (A) Recorded intersections in the city of Ingolstadt, Germany (based on Google Earth) and the total amount of trajectories collected during the recording days (B)
The survey was carried out in Ingolstadt at an intersection triangle: Location 1 is the intersection of Friedrich-Ebert-Straße and Goethestraße, location 2 is the intersection of Goethestraße and Schillerstraße, and location 3 is the intersection of Schillerstraße and Friedrich-Ebert-Straße, as shown in Figure 1 A. The surveys were conducted over three consecutive days from Tuesday, July 4 to Thursday, July 6, 2023. During this period, there were no holidays or public events, ensuring usual traffic conditions. The weather conditions were consistently sunny. Data was collected on all days during a roughly three-hour period between 4pm and 7pm to capture the peak traffic volume. Over the three days, a total of 75,000 trajectories were recorded, of which approximately 8,000 were from cyclists and pedestrians each, as depicted in Figure 1 B.
Two drones were used at each location due to the limited flight time of the drones caused by the battery capacity. The drones were each supposed to perform a transition with a temporal overlap in order to obtain a continuous image of the trajectories. However, due to technical problems at the beginning of each video, as well as sometimes missing reference objects to connect the videos and meta data loss regarding the time stamps, it was not always possible to generate continuous timelines. The available, individual recordings of the drones per location and day, as well as the coherent timelines based on them, are shown as an overview in Figure 2.
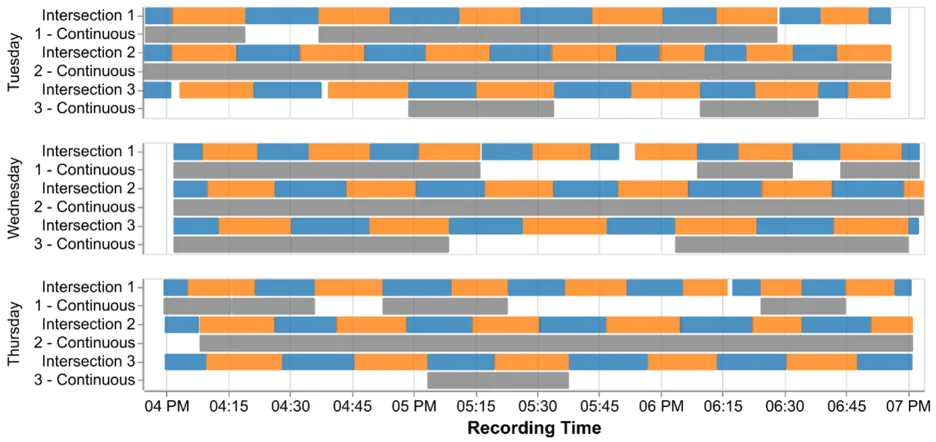
Figure 2: Recorded times during the afternoon peak hours from July 4 to July 6, 2023. Besides the individual drone flights (depicted in blue and orange for the alternating drones respectively), whenever possible a temporal concatenation was carried out (illustrated in grey).
The videos were recorded and analysed at a frequency of 30 fps. For each frame, the object type, the global position as x and y coordinates in the UTM 32N system, the bounding box, the orientation and the speed in the global reference system are available for each road user. Random checks with the LiDAR-data and test vehicles during the data collection revealed position and bounding box errors below 30 cm.
The data is published open source for research purposes under the Creative Commons CC BY-NC 4.0 license.
Acknowledgements: The drone data were gathered with the help of Automatum Data GmbH (Trajectory Generation).
The data can be downloaded from
syncandshare.lrz.de/getlink/fiCe4FwFqAmwnPsdR83LxY/
It contains the described data as csv files (columns separated by “,”), indicating the information in the file name:
Intersection_Day_Starttime-Endtime.csv
One row contains the information on one object at one frame, the first row is the header. The columns are:
timestep | Time From Recording Start [sec], i.e. not a Global Time |
track_id | Unique Identifier per Road User |
category | Road User Category |
x_local | X Coordinate (reference point subtracted from global coordinate) |
y_local | Y Coordinate (reference point subtracted from global coordinate) |
length | Bounding Box Length [m] |
width | Bounding Box Width [m] |
vel_x_glob | Speed in Global X Direction [m/ssec] |
vel_y_glob | Speed in Global Y Direction [m/sec] |
abs_velocity | Speed [m/sec] |
x_glob_UTM32N | Referenced X Coordinate |
y_glob_UTM32N | Referenced Y Coordinate |
rotation | Road User Orientation [rad] |