Employment
Data on employment are also important for modeling mobility. These provide information not only on the economic strength of the municipalities, but also on the employment structure. In addition to data on employees subject to social security contributions, this also includes data on welfare recipients and farm sizes. The picture is rounded off by analyses of the number of employees in manufacturing and construction.
Employees subject to social security
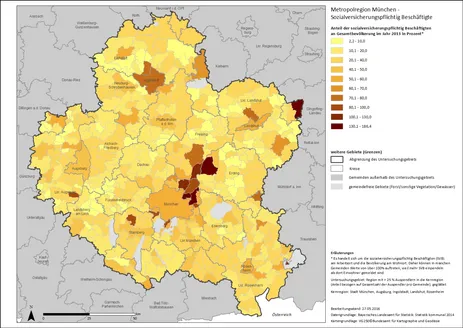
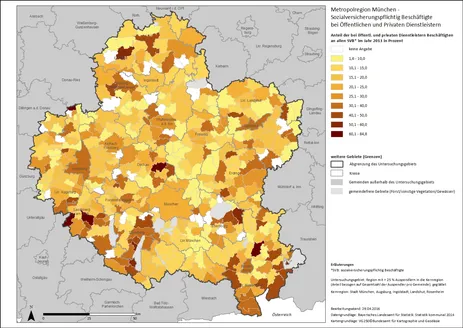
Following an examination of employees subject to social security contributions (SRB) as a whole (Map 1), the individual sectors are discussed (Maps 2-6). It should be noted that these maps do not represent the complete employment situation, as all non-socially insured employees such as self-employed persons or mini-jobbers are not taken into account (no data are available for these).
Map 1 shows the share of all SVB at the place of work in the total population at the place of residence. Thus, values >100% can occur, namely when there are more SVB employed in a municipality than there are inhabitants, i.e. many people commute to work. This is especially the case in municipalities with a small population and large companies. This applies, for example, to the municipality of Graben in the Augsburg district, where the logistics company Amazon is located, and to the municipalities of Oberding and Hallbergmoos with Munich Airport. The high values for Ingolstadt and Dingolfing are probably due to the large automotive plants located there. Overall, the range between the municipalities is very wide, from 2.2% to 186.4%. Rural communities tend to have lower values than urban communities and their surrounding areas.
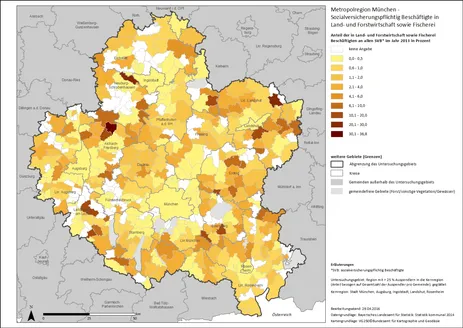
Map 2 shows the share of SVB employed in agriculture, forestry and fishing in relation to all SVB. As expected, urban municipalities show very low values. In rural areas, the picture is very heterogeneous: in some municipalities, only very few persons are employed in this sector, in others, they represent a quarter of all SRP. The municipality of Inchenhofen (Aichach-Friedberg district) even has 36.8%, followed by Postau (Landshut district) with 25.3%. No data are available for one third of all municipalities.
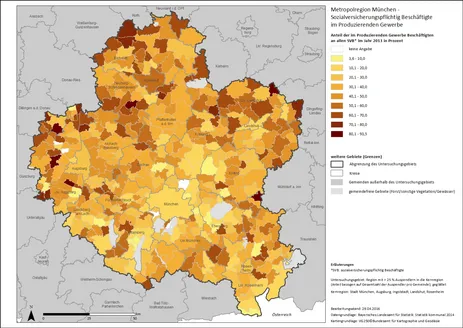
Data for the manufacturing industry are available for almost all municipalities (see Map 3). The range here is from 3.6 % to 93.5 %. The highest values are found in rural communities, where the low number of inhabitants means that individual companies in the manufacturing sector are more prominent than in large cities. Moreover, the high values tend to accumulate in the northern part of the study area.
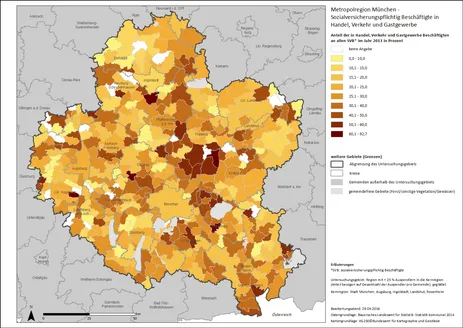
For trade, transport and hospitality, on the other hand, the picture is different (see Map 4). First of all, the entire region around Munich Airport stands out (Erding and Freising districts), as does, to a lesser extent, the wider Munich hinterland. In addition, some municipalities are located at highway access roads, such as Sulzemoos (Dachau district) and Dasing (Aichach-Friedberg district) along the A8 or Windach (Landsberg a. Lech district) along the A96. The community of Graben is the front-runner with 92.7%, which is most likely due to the distribution center of the logistics company Amazon located there. In other municipalities, especially on the edge of the Alps or the Franconian Alb, the tourism sector is likely to be reflected by employees in the hospitality industry (cf. Tourism map).
The distribution of SRP in public and private services also shows a heterogeneous picture (see Map 5). Here, too, rural communities show the highest values, with an accumulation in the southern district of Rosenheim and between Starnberger See and Landsberg am Lech.
High shares in the business services sector, on the other hand, are limited to a few municipalities (see Map 6). Unterföhring (Munich district) tops the list with 86.0%, followed by Kleinaitingen (Augsburg district) with 67.3%. In addition, many people are also employed in this sector in Munich with neighboring municipalities as well as sporadically in other areas. In all other municipalities, higher values tend to be found in cities and lower values in rural areas.
Welfare recipients
Also significant for the employment structure of a municipality is the proportion of people receiving benefits under the Twelfth Social Code (SGB XII). Here, a distinction is made between "assistance for subsistence" according to chap. 3 and "basic benefits for old age and reduced earning capacity" according to chap. 4 SGB XII.
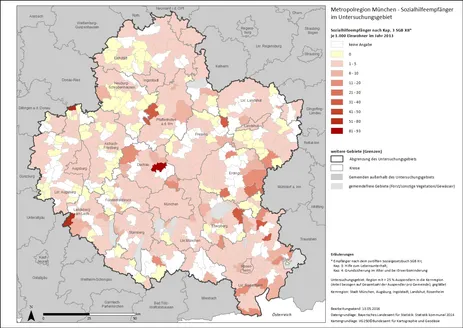
Map 1 shows the number of recipients of social assistance under Chapter 3 per 1,000 inhabitants. The municipalities of Röhrmoos (Dachau district), Igling (Landsberg a. Lech district) and Allmannshofen (Augsburg district) have the highest figures. All three municipalities have large residential facilities for people with disabilities. Around 65 % of the municipalities have values of up to 5 persons per 1,000 inhabitants. No data are available for another 25 % of the municipalities.
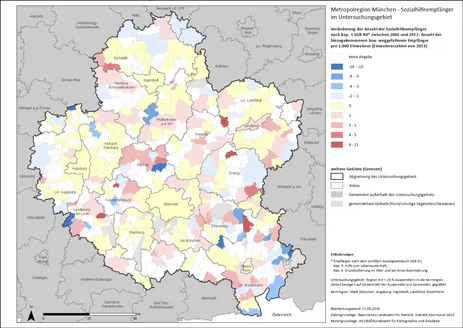
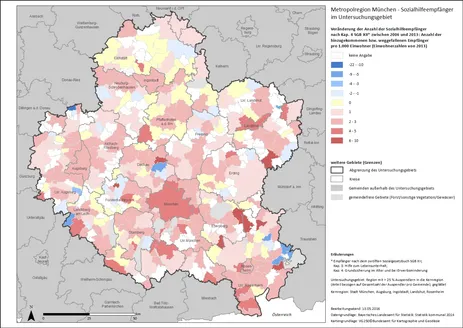
Looking at the change between 2006 and 2013 (Map 2), it can be summarized that the number of social assistance recipients according to chap. 3 SGB XII decreased in about 19 % of the municipalities and increased in the same number of municipalities. There was no change in 33% of the municipalities and no data for 37% of the municipalities. After the municipality of Baiern (Ebersberg district), the above-mentioned municipalities of Allmanshofen, Igling and Röhrmoos had the greatest decrease.
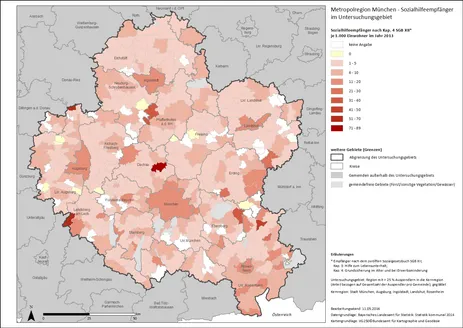
The highest proportions of social welfare recipients under Chapter 4 of the Social Code Book XII in 2013 (Map 3) are also in Röhrmoos, Igling and Allmannshofen. Furthermore, larger cities tend to have higher values than rural areas. In the majority of all municipalities (62 %), there are 5 or fewer recipients of social assistance under chapter 4 per 1,000 inhabitants. No data are available for a further 10% of municipalities.
Between 2006 and 2013, the situation changed as follows: in about 8% of the municipalities, the number of social assistance recipients under ch. 4 decreased, in about 7% of the municipalities there was no change, and about 60% of the municipalities had an increase. 24% of the municipalities did not provide any information in this regard. In addition to Röhrmoos and Allmannshofen, the municipality of Eggstätt (Rosenheim district) experienced the greatest decreases.
Change in the number of agricultural businesses
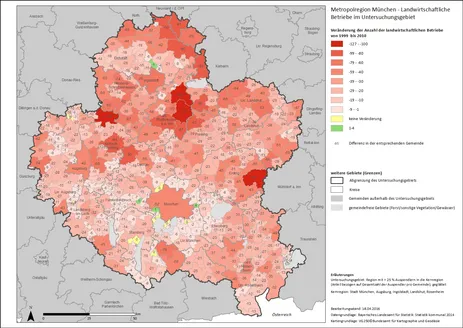
It is reported again and again that many farms are not continued and thus fewer and fewer, but larger farms cultivate the land. This is also true for almost all municipalities in the study area. Map 1 impressively shows the change in the number of farms from 1999 to 2010 in absolute numbers. While farms were added in only four municipalities and no change happened in eight municipalities, the number of farms decreased in all other municipalities. The decrease was particularly strong in the municipalities of Wolnzach (district of Pfaffenhofen a.d. Ilm) with 127 farms, Dorfen (district of Erding) with 116 farms and Geisenfeld (district of Pfaffenhofen a.d. Ilm) with 106 farms.
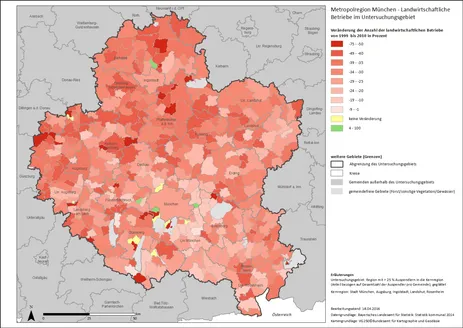
In contrast, Map 2 shows the changes in percent, i.e. the difference is compared with the baseline value. In some cases, this results in a completely different picture, as municipalities that have only experienced a slight decline but where the initial value was already relatively low now also stand out. The best example here is the municipality of Feldafing on Lake Starnberg: The eight farms in 1999 are now only two in 2010, which represents a decline of 75%. In the municipality of Fürstenfeldbruck, six farms were also abandoned, but this is much less significant given an initial value of 41 farms (- 15 %).
Manufacturing industry
Manufacturing refers to all industrial enterprises that process raw materials and intermediate products and also produce end products in the process. This set of maps presents the number of employees in manufacturing and mining and quarrying establishments.
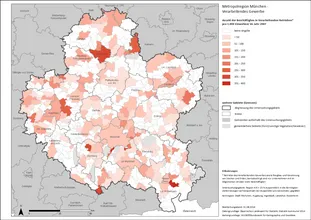
Map 1 shows the situation in 2007: no data are available for about 1/3 of all municipalities, most of which are located in very rural areas. Therefore, it is difficult to discern a pattern. As a rule, smaller to medium-sized municipalities have the highest values, with Pullach i. Isartal, Rohrdorf, Penzberg and Ottobrunn topping the table. One exception is the city of Ingolstadt, which ranks 5th - here, the production location of the car manufacturer Audi may be making itself felt.
In 2013 (Map 2), there is even no information for 40% of all municipalities. The municipality of Pullach i. Isartal was still able to increase the relative number of employees and remains the frontrunner, followed by Penzberg, Neustadt a.d. Donau, Weßling and Ingolstadt.
The change from 2007 to 2013 is further illustrated in Map 3: the share of employees in manufacturing declined in 68 municipalities (15%), mainly affecting larger cities and some of their surrounding municipalities. In 78 municipalities (17.5%), there was an increase, up to almost 500% in the municipality of Taufkirchen: here, the number of persons employed rose from 193 to 1154. In 93 municipalities (21%), there was no change, with no persons employed in manufacturing at either time. No statements can be made for the remaining 205 municipalities (46%).
Construction
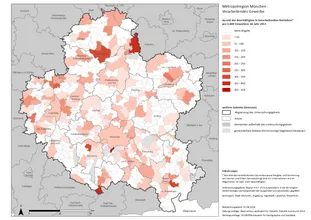
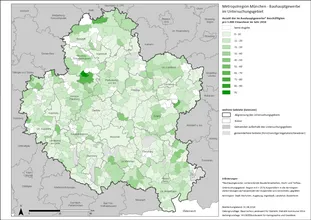
The main construction industry includes businesses engaged in building construction, civil engineering or preparatory construction site work. Map 1 shows the number of people employed in this sector per 1,000 inhabitants in 2010. In most municipalities (44%), no more than 10 people per 1,000 inhabitants were employed in the main construction sector, while in another 25% of municipalities the figure was 11 to 20 people. Only 19% of the municipalities had higher percentages and there is no information for 12%. The highest values are in rural areas, mostly due to the lower number of inhabitants. The leader is the municipality of Langenmoosen (Neuburg-Schrobenhausen district) with 91 employees per 1,000 inhabitants.
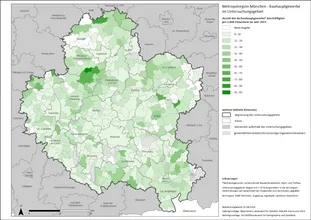
Three years later, in 2013 (Map 2), the shares of the municipalities have hardly changed with regard to the number of employees, although these are not necessarily the same municipalities as in 2010. In that year, 43% of the municipalities had up to 10 employees per 1,000 inhabitants, and another 26% had 11 to 20 employees each. There is no information on this in 13%.
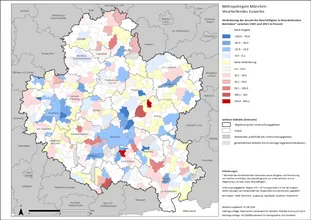
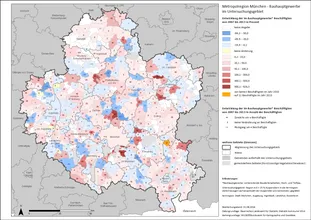
The change between 2010 and 2013 is further illustrated in Map 3. The two-dimensional colors show the relative increase in 54% of the municipalities and the relative decrease in 29% of the municipalities. In addition, the numerical values show the absolute difference in the number of people employed in the construction industry. This is important for a better understanding of the processes, since in some municipalities the proportions fluctuate only due to population movements, although the employment figures remain the same or, in some cases, changes in the latter are offset by the former.
