Housing
The Population chapter shows how the population is distributed, i.e. among other things where how many people live. This chapter takes a closer look at how the population lives. For this purpose, in addition to the size and density of households, the number of existing or newly constructed dwellings and residential buildings are analyzed. The following topics are covered:
Average household size and share of single-person households
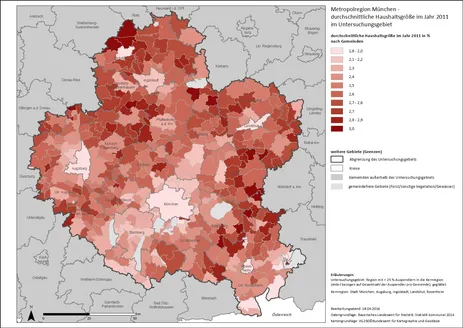
Map 1 shows how many people live per household on average. Rural areas are home to households with the highest averages, while larger cities and some of their surrounding communities have low values. This distribution is closely related to the age distribution: where there are many people under 18 years of age, the households are usually larger as well. Most of these are families with children.
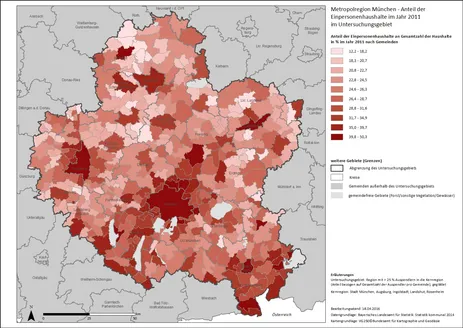
It is not surprising that the share of single-person households is particularly high where the average household size is small, since the number of single-person households helps determine the average household size. Thus, map 2 looks like a complementary image to map 1, with the same (inverse) relationship to the age distribution.
Development of average household size from 1987 to 2011
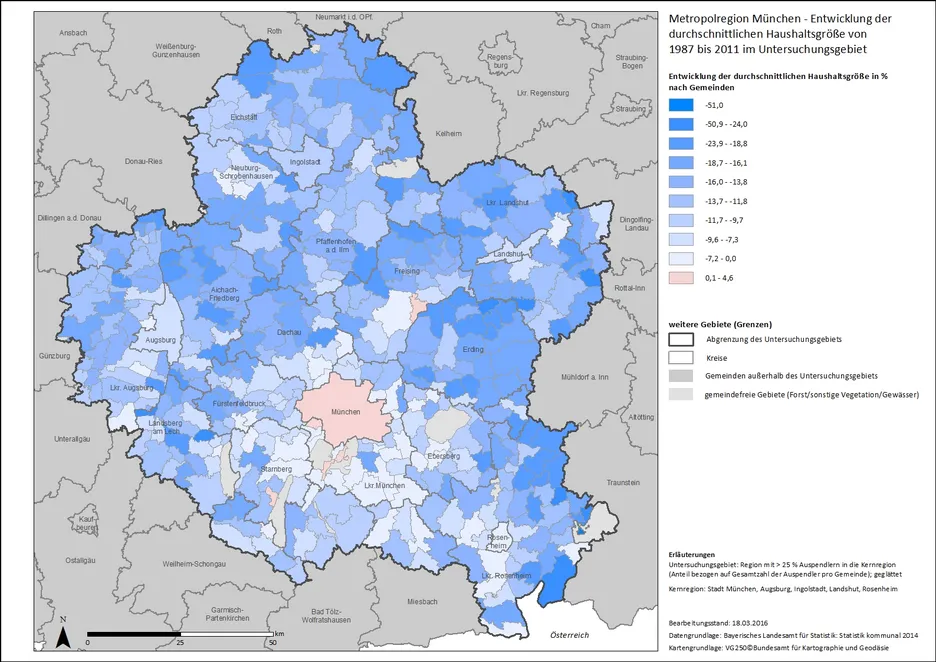
At first glance, it is noticeable that the average household size has decreased in almost all municipalities. In some rural communities, it has declined by up to 30%, and in the community of Chiemsee by as much as 50%. Here, the initial value in 1987 was extremely high at 5.8 persons per household. Overall, it can be seen that the decline in rural regions is generally greater than in cities and their surrounding areas. Only the communities of Marzling, Feldafing, Gräfelfing, Grünwald, Munich and Baierbrunn recorded an increase. This may be due to the fact that the average household size in many cities or urban-influenced communities was already relatively small before 1987 and that the social trend toward single or single-parent households has thus become apparent over the past 25 years, especially in rural areas.
Household density
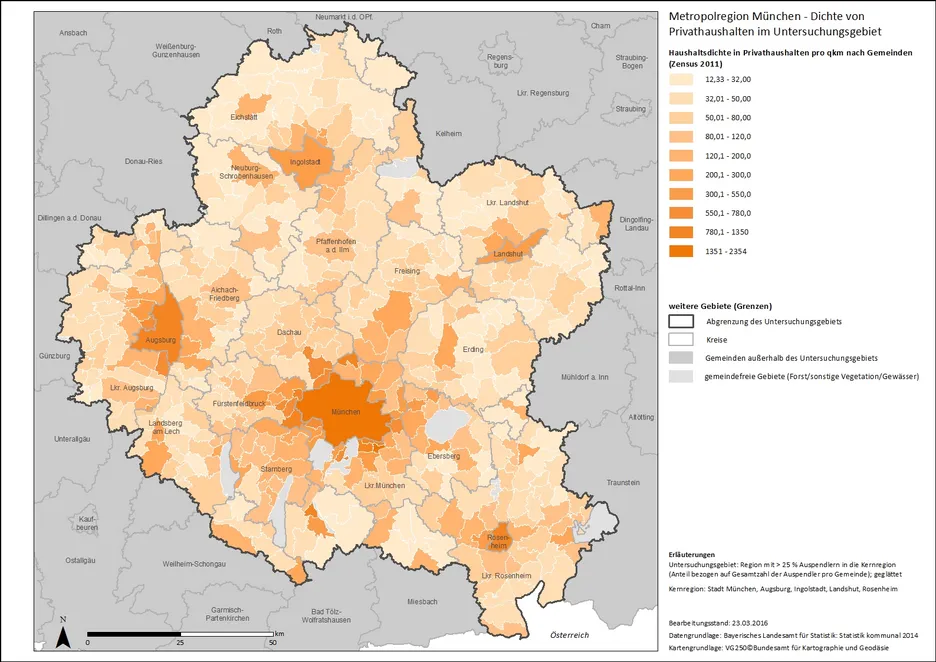
Household density indicates the average number of private households per sq. km. High values result from dense (and high) residential development and a high proportion of single-person households. In cities, both come together: on the one hand, they are virtually defined by dense development, which is partly due to high land prices. On the other hand, the share of single-person households is particularly high here. Accordingly, the highest household densities are found in all the larger cities and in the area surrounding Munich.
Apartment size
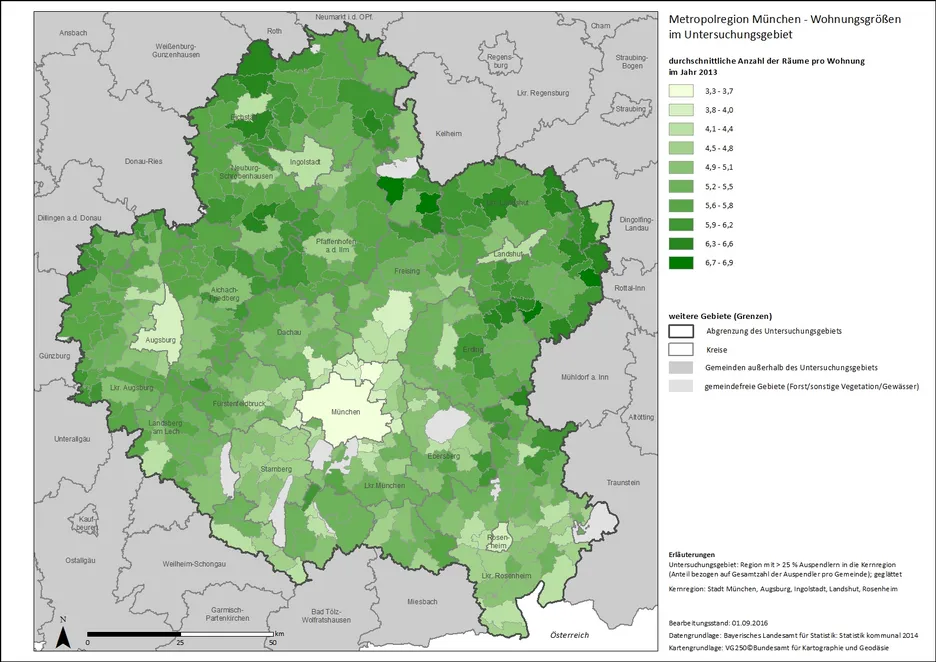
The differences between rural areas and cities also relate to the size of housing units, represented here by the average number of rooms per apartment or house. This is generally significantly higher in rural areas than in cities, where land or rental prices are generally lower and households larger (cf. the distribution of average household size and single-person households).
Thus, while Munich residents had to make do with an average of 3.3 rooms per dwelling in 2013, residents of the municipality of Attenkirchen (Kelheim district) had more than twice as many rooms available on average.
Completions of residential buildings
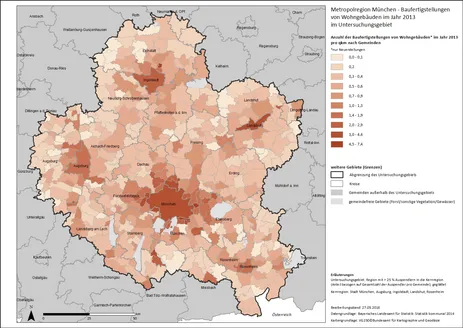
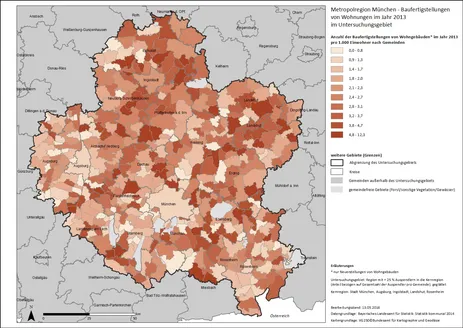
Construction continues diligently in the gaps between existing houses. Map 1 shows the construction completions of residential buildings in 2013 per square kilometer, taking into account only new construction. Since many people live in a small area in cities and the demand for new housing remains high, also due to the steady population growth, the number of new buildings per area is correspondingly higher here than in rural areas (Map 1). At the same time, land prices are generally much lower in rural areas and there is even more building land available, meaning that more people can afford their own home there (Map 2). However, no such clear pattern can be discerned here overall as on map 1. Presumably, other factors such as population development and the designation of building plots play a role here.
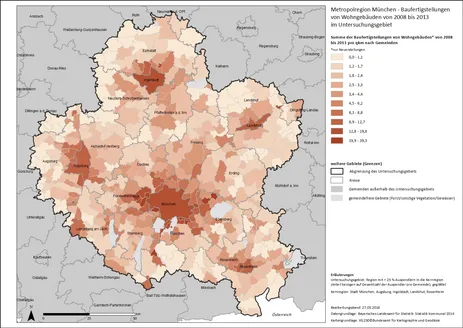
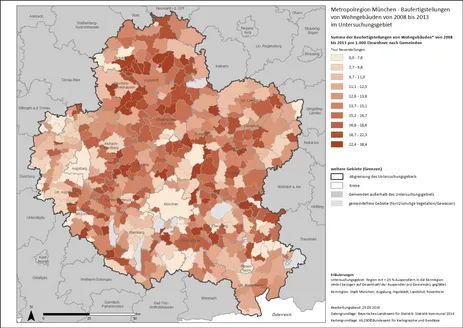
If you look at the development over the previous five years (2008 to 2013), you get a better impression of the trend. Overall, the values are significantly higher because they are added up from the five years. The distribution of construction completions per sq. km. in 2008 - 2013 (see Map 3) is very similar to that of 2013. Overall, the contrast between the metropolitan areas and the rural areas in between and at the periphery of the study area intensifies. The pattern is even more pronounced in terms of housing completions per 1,000 inhabitants (Map 4). The clustering of high values in the vicinity of Ingolstadt is striking, partly reflecting the region's population growth.
Housing completions
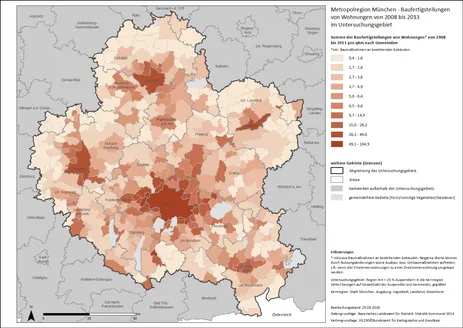
In contrast to residential buildings, construction completions of apartments include not only new construction but also conversions of existing buildings and changes of use. For this reason, negative values can also occur, for example if three one-room apartments are combined to form a three-room apartment or a previous apartment is henceforth used as an office. Also due to conversions, the number of housing completions per sq km in 2013 (Map 1) is much higher than that of residential buildings. Also, the difference between urban and rural areas is even more pronounced here. The values per 1,000 inhabitants are again distributed quite heterogeneously (Map 2). While the cities continue to show relatively high values, many rural communities with lower population figures are added here.
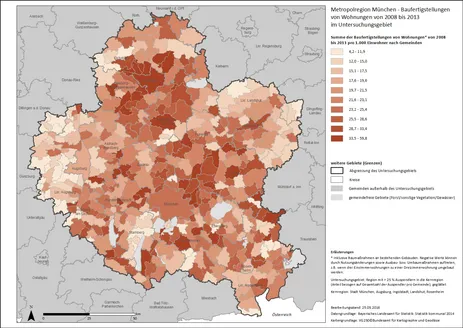
As in the case of residential buildings, the trend of housing completions in 2008-2013 (Map 3) is similar to the values for 2013 only. The map is more heterogeneous, mainly due to the greater differentiation between rural areas: In municipalities on the outskirts of the study area, less was built within the observation period than in those located in or between metropolitan areas, which again corresponds well with the population trend. This also emerges when looking at building completions per 1,000 inhabitants (Map 4), at least for the areas in the far west, east and partly also north of the study area. Both in the Ingolstadt region and north of Munich, there is an accumulation of high values.
Development of the number of apartments
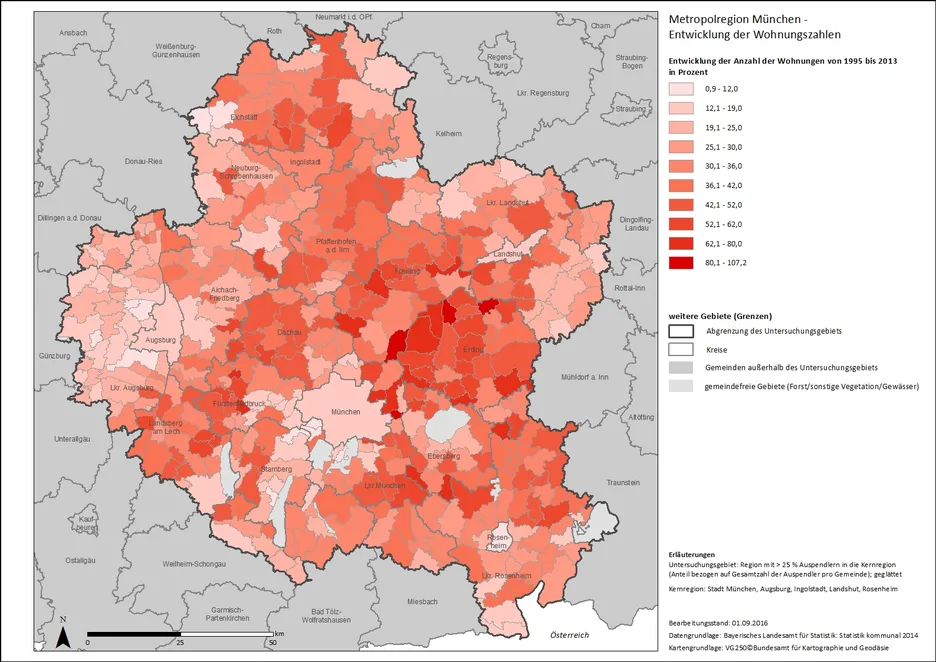
The picture on the development of housing becomes somewhat clearer when looking at the percentage growth over an even longer period of time. The map shows the development of the number of dwellings between 1995 and 2013. The number of dwellings increased in all municipalities, with around 60% of the municipalities recording growth of more than 30% over 18 years. There is a clear gradient from urban to rural areas, which on the one hand is due to the significantly lower initial values in rural areas, and on the other hand corresponds well with the trend toward smaller households there. The concentration of high values in the northeast of Munich is probably related to the relocation of the airport from Munich-Riem to Erdinger Moos in 1992.
