Visualization of Spatial Data in Transportation
| Vortragende/r (Mitwirkende/r) | |
|---|---|
| Nummer | 0000002195 |
| Art | Vorlesung |
| Umfang | 2 SWS |
| Semester | Sommersemester 2024 |
| Unterrichtssprache | Englisch |
| Stellung in Studienplänen | Siehe TUMonline |
| Termine | Siehe TUMonline |
Teilnahmekriterien
Siehe TUMonline
Anmerkung: Basic GIS
Anmerkung: Basic GIS
Lernziele
After participating the module, students are expected to be able:
• to clearly demonstrate conceptual and concrete planning ideas on a problem or on an existing plan.
• to use some Graphic-Design/Visualization Programs in order to development and urban transport plans as well as additional visuals (Tables, charts, text…etc.).
• to structure big/complex data or maps.
• to evaluate quality of maps, presentations and/or posters from others concerning the representativeness of the ideas and comprehensiveness of the figures.
• to produce understandable, attractive and correct transport and urban planning maps/plans.
• to design understandable and comprehensive Tables and Charts in order to illustrate complex situations
Beschreibung
1. Introduction and overview of methods of presentation
2. Presentation of visions, project ideas and planning concepts.
3. Presentation of concrete plans: level of detail, requirements and methods for different scale transport and land use plans
4. Introduction to the illustration and design tool CorelDRAW Graphics Suite.(Students that can use and prefer other tools are allowed to use them for further group work)
5. Visualization Exercises with ArcGIS
6. Homework Presentation 1 and discussion
7. Homework Presentation 2 and discussion
8. Final Presentation
Lehr- und Lernmethoden
The Module consists of lectures, tutorials and exercises. The lectures are on basic design and visualization concepts so that the students can learn how to successfully demonstrate conceptual and concrete planning ideas and be able to evaluate the design differences between good and bad examples. Tutorials are executed in order to show the students how to use a graphic software in planning. Exercises are composed of three homework pieces on different visualization types (conceptual and two different scales) so that students can learn how to organize/structure provided big/complex data, produce new maps/graphics and practice the software. Homework pieces, which are created as group work, will be collected during the semester, will be presented and discussed in the class together. At the end of the semester students will design their own individual poster with those maps and graphics in line with feedbacks that they got during the semester.
Empfohlene Literatur
Yau, Nathan (2011) Visualize This: The Flowing Data Guide To Design, Visualization and Statistics. Ware, Colin (2013) Information Visualization: Perception for Design.
Links
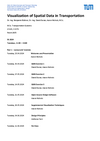
Structure and Dates
For structure and dates of the course, please click the figure.